Scientific Investigations Report 2006-5030
U.S. GEOLOGICAL SURVEY
Scientific Investigations Report 2006-5030
June 2003 geochemical data and inferred predominant reduction-oxidation (redox) conditions are shown in table 2. The predominant redox conditions were inferred by considering dissolved oxygen and dissolved H2 concentrations combined with other geochemical concentrations. Dissolved-oxygen concentrations greater than 1 mg/L generally indicate aerobic conditions and concentrations less than 1 mg/L indicate one of the anaerobic conditions. Exceptions are possible when water levels in low-yield monitoring wells are drawn down by pumping while being sampled, or when long well screens intersect aerobic ground water near the water table and anaerobic ground water at greater depths. Chapelle and others (1995) developed a method to determine the specific redox condition of anaerobic ground water based on dissolved H2 concentrations, where less than 0.05 nanomolar (nM) indicates manganese or nitrate reduction, 0.1‑0.8 nM indicates iron reduction, 1-5 nM indicates sulfate reduction, and greater than 5 nM indicates methanogenesis. Exceptions are common in contaminant plumes because of complicating effects from different absolute concentrations of dissolved redox species, from different iron-oxide minerals that serve as electron acceptors, from different ground-water temperatures, and from overlapping and not exclusive redox conditions (Hoehler and others, 1998; Jakobsen and others, 1998; Christensen and others, 2000). Therefore, all geochemical data and best professional judgment were used to infer the predominant redox conditions listed in table 2. For instance, at well MW2-8, the 1.5 mg/L of dissolved oxygen measured was not likely indicative of predominantly aerobic conditions in the aquifer. The dissolved-oxygen concentration at MW2‑8 decreased steadily to less than 1 mg/L during the first 30 minutes of low-flow purging, but the concentration then increased steadily to 1.5 mg/L as purging continued and the well nearly went dry. Ground water entering the well and trickling down the screen to the pump intake likely added dissolved oxygen to the sample. The manganese concentration of 3.0 mg/L at MW2-8 is not consistent with aerobic conditions in the aquifer, and manganese concentrations are not affected by drawdown during sampling.
At former Building 957 drum storage area, aerobic redox conditions were inferred only at well 2MW-1 near the southwest corner of the site. Dissolved-oxygen concentration at well 2MW-1 was 1.0 mg/L, nitrate concentration was 0.62 mg/L, and only trace concentrations of iron (II) and manganese were detected. These data clearly indicate that the 15-ft long screen intersects aerobic ground water, but also may intersect anaerobic water at depth. The lowest concentrations of dissolved organic carbon (3.7 mg/L) and carbon dioxide (35 mg/L) were measured in a water sample collected from well 2MW-1, which is consistent with relatively low microbial activity and limited dissolved-oxygen consumption.
The anaerobic redox conditions and geochemical concentrations detected in seven of eight wells sampled varied considerably across the relatively small site. Although all dissolved H2 concentrations indicated iron reduction as the predominant redox condition, other geochemical concentrations indicated additional redox conditions were present in the shallow aquifer at the site. Manganese concentrations at wells 2MW-3, 2MW-4, and MW2-8 nearly equaled or exceeded iron (II) concentrations, indicating substantial manganese reduction at or near those wells. Relatively high sulfide and methane concentrations and relatively low sulfate concentration at well 2MW-2 indicated sulfate reduction and methanogenesis at or near that well. The lack of sulfide and sulfate with corresponding high methane concentration at 2MW-6 indicated methanogenesis likely was the predominant redox processes at that well.
[Well No.: MW, monitoring well. Predominant redox condition: A, aerobic; Fe, iron reducing; M, methanogenic; Mn, manganese reducing; S, sulfate reducing. Abbreviations: nM, nanomolar; mg/L, milligram per liter; N, nitrogen; µS/cm, microsiemen per centimeter at 25° Celsius. –, not analyzed; <, actual value is less than value shown]
| Well No. | Predominant redox condition | Dissolved hydrogen (nM) | Dissolved oxygen (mg/L) | Filtered (dissolved) organic carbon (mg/L) | Filtered nitrate + nitrite (mg/L as N) | Filtered manganese (mg/L) | Filtered iron (II) (mg/L) |
|---|---|---|---|---|---|---|---|
| 2MW–1 | A | – | 1.0 | 3.7 | 0.62 | 0.04 | 0.02 |
| 2MW–2 | S, M | 0.3 | .2 | 20 | <1.2 | .65 | 25 |
| 2MW–3 | Mn, Fe | .2 | .1 | 19 | <.06 | 1.8 | .95 |
| 2MW–4 | Mn, Fe | .1 | .1 | 4.2 | <.06 | 2.0 | 2.5 |
| 2MW–6 | M | – | .6 | 17 | <.06 | .05 | .58 |
| MW2–5 | Fe | .7 | <.1 | 30 | <.06 | 1.5 | 10 |
| MW2–8 | Mn | – | 1.5 | 12 | <.06 | 3.0 | <.01 |
| MW2–10 | Fe | .1 | <.1 | 15 | <.06 | 1.5 | 27 |
| Well No. | Predominant redox condition | Filtered sulfate (mg/L) | Unfiltered sulfide (mg/L) | Dissolved methane (mg/L) | Dissolved carbon dioxide (mg/L) | pH (units) | Specific conductance (µS/cm) | Filtered chloride (mg/L) |
|---|---|---|---|---|---|---|---|---|
| 2MW–1 | A | 4.7 | 0.01 | 0.12 | 35 | 6.3 | 220 | 4.21 |
| 2MW–2 | S, M | 1.1 | .06 | 13 | 250 | 6.3 | 735 | 9.56 |
| 2MW–3 | Mn, Fe | 3.5 | <.01 | .96 | 250 | 6.3 | 794 | 17.4 |
| 2MW–4 | Mn, Fe | 4.8 | <.01 | – | 140 | 6.2 | 431 | 5.38 |
| 2MW–6 | M | <.2 | <.01 | 9.8 | 350 | 6.2 | 902 | 12.9 |
| MW2–5 | Fe | 5.5 | <.01 | .37 | 70 | 6.2 | 267 | 4.07 |
| MW2–8 | Mn | 2.6 | – | .05 | 375 | 6.3 | 1,220 | 6.48 |
| MW2–10 | Fe | 3.3 | .03 | 2.7 | 180 | 6.4 | 439 | 4.16 |
A predominant redox condition was inferred for each sample, although the geochemical data from most water samples did not indicate that the assigned redox condition was exclusive. Most wells sampled at the study site are screened across at least two of the five defined water-bearing units beneath Area 2, and those units vary substantially in their organic carbon contents (URS Consultants, Inc., 1993). Organic carbon is a primary control of redox conditions, so redox conditions likely changed over short vertical distances in the heterogeneous aquifer at the site, and sampling drew water to the well from zones with different redox conditions.
Historical dissolved iron and manganese concentrations measured in selected wells during 1991-92 (URS Consultants, Inc., 1993) were similar to those measured in 2003 with two exceptions. Neither iron nor manganese was detected in water samples from well 2MW-2 during 1992 (with detection limits of 0.62 and 0.06 mg/L, respectively), whereas the 2003 iron (II) and manganese concentrations were substantially greater (25 and 0.65 mg/L, respectively). At well MW2‑5, the 1992 iron and manganese concentrations in samples were <0.62 and 0.32 mg/L, respectively, whereas the 2003 concentrations were substantially greater (10 and 1.5 mg/L, respectively). The substantial increases in dissolved-metals concentrations may indicate that redox conditions changed from aerobic to anaerobic sometime between 1992 and 2003.
The 2003 dissolved organic carbon concentrations in water samples from the two most upgradient wells (2MW‑1 and 2MW-4) ranged from 3.7 to 4.2 mg/L, whereas the concentration in samples from the other six wells farther downgradient ranged from 12 to 30 mg/L. The downgradient concentrations are relatively high, and can be reasonably expected to help maintain anaerobic conditions in shallow ground water in the foreseeable future. Historical carbon data are not available for evaluating changes and persistence of anaerobic conditions over time.
The many possible biodegradation mechanisms for chloroethenes can be broadly categorized in two groups—reductive dechlorination and microbial oxidation. Reductive dechlorination is a process where electrons are transferred from relatively simple organic compounds (electron donors) to chloroethenes (electron acceptors), replacing a chlorine atom to create daughter products with one less chlorine atom. Microbial oxidation is a process where chloroethenes serve as the electron donor (are oxidized) directly to chlorine and carbon dioxide through various pathways catalyzed by micro-organisms. Details of those mechanisms have been determined by multiple researchers over the last few decades and are not repeated in this report—refer to Bradley (2003) for a current and thorough review on the history and ecology of chloroethene biodegradation. Occurrence and potential efficiency of specific mechanisms for chloroethene biodegradation at a given contamination site are particularly sensitive to redox conditions of the ground water contaminant plume (table 3). Generally, reductive dechlorination mechanisms are most favorable under strongly anaerobic redox conditions (such as methanogenesis and sulfate reduction), and are most efficient for biodegradation of the more highly chlorinated compounds tetrachloroethene (PCE) and TCE. Reductive dechlorination mechanisms are common in anaerobic ground water and are thought to be the primary cause for biodegradation of the parent compounds PCE and TCE to form the daughter products DCE and VC. Conversely, microbial oxidation mechanisms are most favorable under aerobic or mildly anaerobic redox conditions (manganese and iron reduction), and are most efficient for biodegradation of the less chlorinated compounds cis-DCE and VC. Widespread occurrence of microbial oxidation mechanisms is not as well documented as that of reductive dechlorination, in large part because the oxidation daughter products carbon dioxide and chloride are not uniquely diagnostic to chloroethene biodegradation. Regardless, the potential for microbial oxidation mechanisms under aerobic conditions can be substantial where an anaerobic contaminant plume encounters aerobic water (such as at a discharge point to surface water), and the potential for microbial oxidation of VC and DCE under anaerobic conditions can be substantial in contaminant plumes where redox conditions are only mildly reducing.
[Data from Bradley (2003). Contaminant: PCE, tetrachloroehthene; TCE, trichloroethene; cis-DCE, cis-1,2-dichloroethene; VC, vinyl chloride. Biodegradation mechanism: MO, microbial oxidation; RD, reductive decholrination. Predominant redox condition: –, indicates no evidence for this mechanism under this redox condition]
| Contaminant | Biodegradation mechanism | Predominant redox condition | ||||
|---|---|---|---|---|---|---|
| Aerobic | Manganese reduction | Iron reduction | Sulfate reduction | Methanogenesis | ||
| PCE | RD | – | Good | Good | Excellent | Excellent |
| MO | Fair1 | – | – | – | – | |
| TCE | RD | – | Fair | Good | Good | Excellent |
| MO | Good1 | – | – | – | – | |
| cis-DCE | RD | Poor | Poor | Poor | Fair | Good |
| MO | Excellent | Good | Poor | Poor | Poor | |
| VC | RD | Poor | Poor | Poor | Fair | Fair |
| MO | Excellent | Excellent | Excellent | Good | Good2 | |
1Aerobic cometabolism only — considered to be a transient mechanism.
2Associated with humic-acids reduction rather than methanogenic activity.
Chloroethene concentrations from 1991 through 2004 are shown in table 4. August 2003 data were collected and analyzed by the USGS; all other data were collected and analyzed by the Navy and retrieved in 2004 by the USGS from the Navy’s Technical Data Management System. In addition to the eight wells sampled for geochemicals by the USGS during 2003, data are shown for two wells screened near the bottom of the upper aquifer at the site (MW2-6 and MW2-7) to illustrate that contaminants have not been detected at depth, and one shallower well (2MW-5) to illustrate the decrease in upgradient TCE concentrations measured between 1995 and 1998.
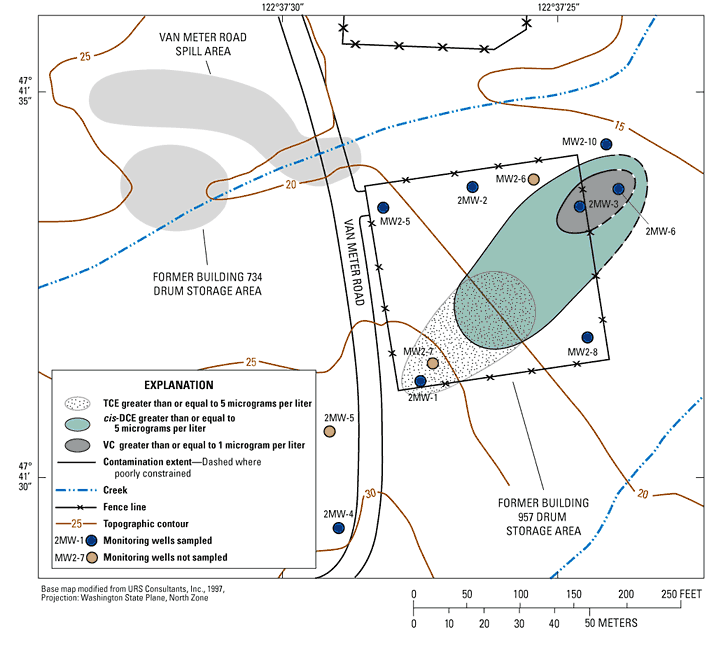
During 2003, only TCE was detected near the upgradient margin of former Building 957 drum storage area (well 2MW-1), and only cis-DCE and VC were detected near the downgradient margin of the site (wells 2MW-3 and 2MW-6) (fig. 3). Total BTEX was detected only at well 2MW-3 at a concentration of 0.21 µg/L (data not shown).
[All concentrations are in micrograms per liter. All data except those from August 2003 were collected by the U.S. Navy. Positive detections are bold. Well No.: MW, monitoring well. Concentrations: PCE, tetrachloroethene; TCE, trichloroethene; cis-DCE, cis-1,2-dichloroethene; trans-DCE, trans-1,2-dichloroethene; 1,2-DCE, total 1,2-dichloroethene; VC, vinyl chloride. Abbreviations: na; not applicable. Symbols: <, actual value is less than value shown; –, not analyzed]
| Well No. | Date sampled | PCE | TCE | cis-DCE | trans-DCE | 1,2-DCE | VC | cis-DCE:VC |
|---|---|---|---|---|---|---|---|---|
| 2MW-1 | 01-16-92 | <10 | 24 | – | – | <10 | <10 | na |
| 06-22-92 | <10 | 36 | – | – | <10 | <10 | na | |
| 11-21-95 | <1 | 41 | <1 | <1 | – | <1 | na | |
| 09-30-96 | <1 | 29 | <1 | <1 | – | <1 | na | |
| 10-16-97 | <1 | 29 | <1 | <1 | – | <1 | na | |
| 10-08-98 | <.2 | 28 | <.2 | <.2 | – | <.2 | na | |
| 11-22-98 | <.5 | 17 | <.5 | <.5 | – | <.5 | na | |
| 11-17-00 | <.5 | 22 | <.5 | <.5 | – | <.5 | na | |
| 11-19-01 | – | 16 | <.1 | – | – | <.2 | na | |
| 06-17-02 | <.2 | 11 | <.1 | <.2 | – | <.2 | na | |
| 06-03-03 | – | 12 | <.5 | – | – | <.5 | na | |
| 06-15-04 | – | 10 | <.5 | – | – | <.5 | na | |
| 2MW–2 | 07-10-91 | <.01 | <.01 | – | – | <5 | 1 | na |
| 01-16-92 | <10 | <10 | – | – | <10 | <10 | na | |
| 08-19-03 | <1 | <1 | .14 | <1 | – | <1 | na | |
| 2MW–3 | 01-16-92 | <10 | <10 | – | – | 22 | 4 | 5.5 |
| 11-20-95 | <1 | 1 | 19 | <1 | – | 4 | 4.8 | |
| 08-19-03 | <1 | 1 | 18 | <1 | – | 1.8 | 10 | |
| 2MW–4 | 11-20-95 | <1 | <1 | <1 | <1 | – | <1 | na |
| 08-20-03 | <1 | <1 | <1 | <1 | – | <1 | na | |
| 2MW–5 | 11-21-95 | <1 | 11 | 7 | <1 | – | <1 | na |
| 09-29-96 | <1 | 2 | <1 | <1 | – | <1 | na | |
| 10-16-97 | <1 | 2 | <1 | <1 | – | <1 | na | |
| 10-08-98 | <.2 | 2.1 | .26 | <.2 | – | <.2 | na | |
| 11-22-98 | <.5 | .4 | <.5 | <.5 | – | <.5 | na | |
| 2MW–6 | 11-20-95 | <1 | <1 | 10 | <1 | – | 4 | 2.5 |
| 09-30-96 | <1 | <1 | 15 | <1 | – | 5 | 3.0 | |
| 10-16-97 | <1 | <1 | 11 | <1 | – | 4 | 2.8 | |
| 10-08-98 | <.2 | <.2 | 9.5 | <.2 | – | 2.7 | 3.5 | |
| 11-22-98 | <.5 | <.5 | 12 | <.5 | – | 2.7 | 4.4 | |
| 11-17-00 | <.5 | <.5 | 15 | <.5 | – | 2.9 | 5.2 | |
| 11-19-01 | – | <.2 | 7.0 | – | – | 1.2 | 5.8 | |
| 06-17-02 | <.2 | <.2 | 13 | <.2 | – | 2.1 | 6.2 | |
| 06-03-03 | – | <.5 | 9.9 | – | – | 1.5 | 6.6 | |
| 06-15-04 | – | <.5 | 6.9 | – | – | .86 | 8.0 | |
| MW2–5 | 06-21-91 | <.01 | <.01 | – | – | <5 | <.01 | na |
| 01-16-92 | <10 | <10 | – | – | <10 | <10 | na | |
| 08-19-03 | <1 | <1 | <1 | <1 | <1 | <1 | na | |
| MW2–6 | 06-26-91 | <.01 | <.01 | – | – | <5 | <.01 | na |
| 06-22-92 | <10 | <10 | – | – | <10 | <10 | na | |
| 11-01-00 | <.5 | <.5 | <.5 | <.5 | – | <.5 | na | |
| MW2–7 | 06-24-91 | <.01 | <.01 | – | – | <5 | <.01 | na |
| 06-22-92 | <10 | <10 | – | – | <10 | <10 | na | |
| MW2–8 | 06-24-91 | <.01 | <.01 | – | – | <5 | <.01 | na |
| 01-16-92 | <10 | <10 | – | – | <10 | <10 | na | |
| 01-04-02 | – | <.2 | .72 | – | – | <.2 | na | |
| 01-19-02 | <.2 | <.2 | .97 | <.2 | – | <.2 | na | |
| 06-03-03 | – | <.5 | 1.4 | – | – | <.5 | na | |
| 06-15-04 | – | <.5 | 1.9 | – | – | <.2 | na | |
| MW2–10 | 07-10-91 | <.01 | <.01 | – | – | 5 | <.01 | na |
| 01-27-92 | <10 | <10 | – | – | <10 | <10 | na | |
| 08-20-03 | <1 | <1 | .4 | <1 | – | <1 | na |
The U.S. Environmental Protection Agency protocol (Wiedemeier and others, 1998) for evaluation of natural attenuation of chlorinated solvents in ground water recommends multiple lines of evidence. Because biodegradation is considered a critical component of natural attenuation, many of those lines of evidence are appropriate, including: (1) demonstration of existence of redox conditions conducive to known mechanisms of chloroethene biodegradation; (2) demonstration of production of daughter products indicative of chloroethene biodegradation; and (3) demonstration of a distinct trend toward decreasing chloroethene concentrations. Geochemical and chloroethene data collected for this investigation were evaluated according to those three lines of evidence.
The potential for specific chloroethene biodegradation mechanisms at the former Building 957 drum storage area was determined by comparing ground-water redox conditions to the data shown in table 4, and the likelihood that the mechanisms are actually occurring were inferred from measured contaminant concentrations. The evaluation focused on the presumed contaminant flow path at the site extending from well 2MW-1 downgradient to wells 2MW‑3 and 2MW-6. That flow path is consistent with the June 2003 water levels measured at the site (fig. 2). The three wells of interest are the only wells where recent contaminant concentrations exceeded the remediation goals established for the site. Those remediation goals are 5 µg/L for TCE, 70 µg/L for cis-DCE, and 1 µg/L for VC (URS Consultants, Inc., 1994).
At the upgradient (southwest) corner of the former Building 957 drum storage area (well 2MW-1), aerobic redox conditions were inferred. Reductive dechlorination of TCE does not occur under aerobic conditions, which is consistent with the detection of TCE at 2MW-1 and the corresponding lack of cis-DCE and VC daughter products. TCE concentrations at well 2MW-1 generally decreased between 1992 and 2004 (table 4, but the lack of daughter products at the well indicates that the trend likely is due to non-destructive attenuation mechanisms such as dilution or dispersion.
At the two most contaminated downgradient wells at the site (2MW-3 and 2MW-6), the inferred redox conditions were manganese/iron reducing and methanogenic, respectively. The potential for reductive dechlorination of TCE is good to excellent under such conditions, which is consistent with measured TCE concentrations of only 1 µg/L at the manganese/iron reducing well, and <0.5 µg/L at the methanogenic well. Concentrations of daughter products cis-DCE and VC were substantially greater than the TCE concentrations at the downgradient wells. TCE concentrations at wells 2MW-3 and 2MW-6 always have been low (table 4) and substantially less than the 5 µg/L remediation goal for the site.
The potential for reductive dechlorination of cis-DCE is poor under manganese/iron reducing conditions and good under methanogenic conditions, consistent with the higher cis‑DCE concentration of 18 µg/L at the manganese/iron reducing well (2MW-3) compared to the lower 9.9 µg/L concentration at the methanogenic well (2MW-6). The cis-DCE concentrations at wells 2MW-3 and 2MW-6 always have been less than 20 µg/L with no strong increases or decreases during the period of record (table 4). Those concentrations are substantially less than 70 µg/L remediation goal for the site. However, cis-DCE concentrations less than the remediation goal are still a concern because of reductive dechlorination into VC, which has a remediation goal of only 1 µg/L at the site.
The potential for microbial oxidation of VC is excellent to good under manganese/iron reducing and methanogenic redox conditions, but the potential for reductive dechlorination of VC is only fair. In contrast to cis-DCE concentrations, VC concentrations at wells 2MW-3 and 2MW-6 have decreased over 9 to 14 years, and an increase was measured in the ratio of cis-DCE to VC concentrations (table 4). Those data indicate that VC is less persistent than cis-DCE in the downgradient wells, which is strong evidence for relatively efficient microbial oxidation of VC. The potential for microbial oxidation of cis-DCE is good under manganese reducing conditions (indicated at well 2MW-3 by the relatively high manganese concentration of 1.8 mg/L), but overall it appears that the biodegradation rate for cis-DCE from both reductive dechlorination and microbial oxidation is less than the biodegradation rate for VC. The daughter products from microbial oxidation of VC are carbon dioxide and chloride, and the concentrations of those analytes in well 2MW-3 and 2MW-6 were substantially higher than those detected upgradient at well 2MW-1 (table 2). Carbon dioxide and chloride concentrations were significantly higher than concentrations resulting from biodegradation of a few micrograms per liter of chloroethenes; therefore, the carbon dioxide and chloride data alone are not direct evidence for microbial oxidation. The increase in the cis-DCE to VC ratio over time, however, is strong evidence for microbial oxidation of VC because non-destructive attenuation mechanisms such as dispersion or dilution likely would not affect the cis-DCE to VC ratio.
For more information about USGS activities in Washington, visit the USGS Washington Water Science Center home page .

![]() U.S. Department of the Interior |
U.S. Geological Survey
U.S. Department of the Interior |
U.S. Geological Survey
Persistent URL: https://pubs.water.usgs.gov/sir20065030
Page Contact Information: Publications Team
Page Last Modified: Thursday, 01-Dec-2016 18:54:48 EST
