Scientific Investigations Report 2005-5255
U.S. GEOLOGICAL SURVEY
Scientific Investigations Report 2005-5255
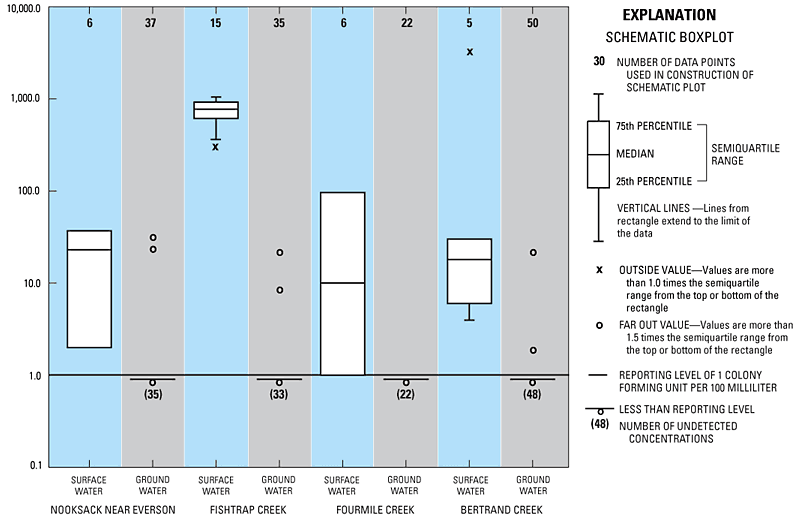
In this study, E. coli bacteria were rarely detected in samples of ground water discharging to streams in the Nooksack River lowland. E. coli were detected in 9 of 145 ground-water samples analyzed and concentrations of E. coli in ground water typically were much lower than concentrations of E. coli in the overlying surface water. Additionally, when E. coli was detected in ground water, it usually was detected in only one or two of the six to nine ground-water samples collected at a given site. However, E. coli were detected in all samples of surface water from the Nooksack River, Fishtrap and Fourmile Creeks, and the tributary to Bertrand Creek at concentrations ranging from 2 to 5,000 CFU/100 mL. Comparison of the concentration of E. coli in surface-water and ground-water samples collected from the ground-water discharge monitoring sites is shown in figure 16. The near absence of E . coli in samples of discharging ground water indicate that ground water discharging to lowland streams of the Nooksack River basin through the streambed is not likely the primary source of fecal contamination observed in those surface waters.
Surface-water monitoring data indicated that large concentrations of fecal coliforms were more common in surface-water samples collected during the spring and summer growing period when manure application to fields was routine, than in samples collected in the autumn and winter (Northwest Indian College, 2004). Additional ground-water samples were collected for analysis of E. coli at the ground-water discharge study site on the tributary to Bertrand Creek, which is essentially a drainage ditch bisecting a dairy pasture on which manure was regularly applied. During the early part of May 2004, manure was applied to the field west of this drainage ditch by field spray method and to the field east of the ditch by direct injection. Samples of discharging ground water were collected from all nine piezometers during the next significant rain event that followed. Ground-water samples were collected on May 27, 2004, when more than 1 in. of rain was recorded. Although E. coli was not detected in any of the ground-water samples; the concentration of E. coli in surface water on May 27, 2004, was 3,470 CFU/100 mL. About one-half of the piezometers sampled on May 27 showed a significant increase in specific conductance which may be related to the rain event. Prior to the rain event, E. coli concentrations in surface water were 18 CFU/100 mL. An additional round of samples was collected 1 week later (June 4) and E. coli again was not detected in the ground-water samples although the surface-water concentration of E. coli was 30 CFU/100 mL. Clearly, fecal bacteria were being transported to the surface water at the time of the rain event although not through the ground-water pathway sampled by the piezometers.
Concentrations of E. coli also were determined for samples of surface water and ground water collected from the nine network piezometers along Fishtrap Creek (fig. 17). E. coli was detected in all surface-water samples at concentrations ranging from 350 to more than 1,000 CFU/100 mL, but not in the ground-water samples where vertical hydraulic gradient and other water-quality data indicated ground water was discharging through the streambed. At one piezometer (PZF-6), where measurement of the vertical hydraulic gradient indicated that water from the stream was recharging the ground-water system, E. coli bacteria were detected at concentrations of 0 to 6 CFU/100 mL in ground water. The presence of E. coli in these ground-water samples likely is due to the advective transport of bacteria contained in stream water that is recharging the ground-water system. However, the in-stream piezometer at this site had to be re-installed on each visit. Thus, the measured bacteria could potentially be the result of recent disturbance of the streambed sediments or because the piezometer was exposed to bacteria in the surface water during re-installation.
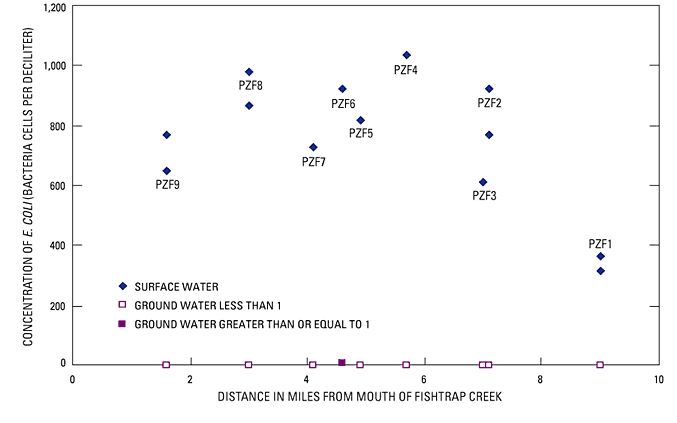
At the most upstream site (PZF-1; 9 mi upstream of the mouth of Fishtrap Creek) near the border between the United States and Canada, the concentration of E. coli in streamflow generally was less than one-half of that measured in streamflow at downstream sites. The pattern of increased fecal coliform bacteria present in streamflow between piezometers PZF-1 and PZF-3 also was detected in periodic monitoring conducted biweekly between 2002 and 2004 by Northwest Indian College (2004). The 2 years of monitoring data show that concentrations at the downstream site were larger than concentrations at the upstream site about 78 percent of the time. Short-term variation in bacterial concentration data from stream-water samples is site dependent and may exceed an order of magnitude (Morace and Mckenzie, 2002). The typical pattern of larger concentrations measured at piezometer PZF-2 than PZF-1 indicates a source of fecal bacteria between the two piezometers.
The source of the increase in fecal bacteria detected in surface-water samples from Fishtrap Creek at these two sites is not well documented. The lack of substantial concentrations of E. coli in samples of ground water discharging through the streambed of this reach indicates that at the ground-water discharge study site, ground water is not the contamination pathway. Physical filtration is a major factor limiting the transport of bacteria in the ground-water system. The size of E. coli bacteria on cells typically is 0.5 to 2 microns, thus, they are on the order of clay-size particles. However, they typically are sorbed to clay particles or clustered in clumps, so they are effectively larger and can be readily trapped within the pore space of silty and sandy soils. Movement of bacteria through soils is thought to occur primarily from preferential flow processes (Smith and others, 1985; Abu-Ashour and others, 1998).
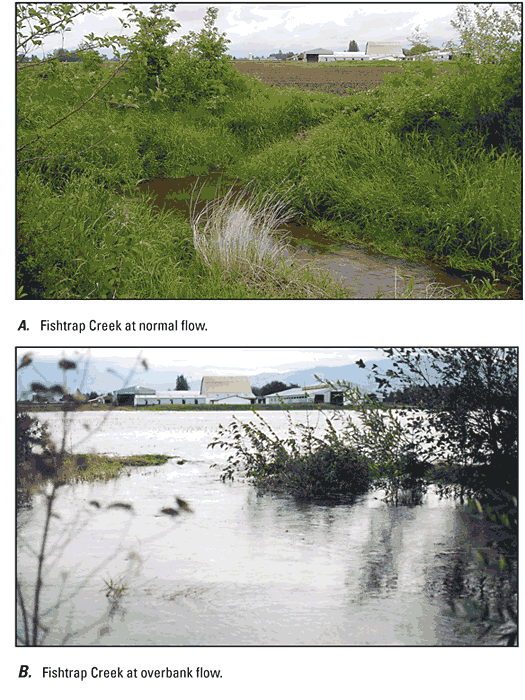
Other pathways that might introduce fecal contamination in this reach include overland flow during storm events that deposit large concentrations of bacteria in streambed sediments and discharge from subsurface tiles drains, which have been shown to be a significant pathway for fecal bacteria. Large precipitation events in the area contribute significant overland flow to the portions of Fishtrap Creek (fig. 18). Streambed sediments may provide a long-term refuge for fecal coliform bacteria. Soils in the areas adjacent to this reach of Fishtrap Creek are mapped as ‘Artificially Drained’ (U.S. Department of Agriculture, 1992). Fecal bacteria present in subsurface tile drainage is well documented (Patni and others, 1984; Dean and Foran, 1992; Goehring and others, 1999; Jamieson and others, 2002) and tile drainage can represent an important avenue for the transport of bacteria to surface-water systems (Hunter and others, 2000). If artificial drainage is a significant pathway for bacteria transport to surface waters; the use of controlled drainage (implemented to reduce the flux of nutrient to surface water) also may provide a management strategy to reduce bacteria loading by promoting attenuation and die-off of fecal coliforms. Fleming and MacAlpine (1995) showed that drains closed for 1 week would reduce bacteria loading from tile drainage discharge.
Only three samples of drainage discharge were obtained and E. coli were not detected in any of the three samples. Locations where isolated samples of discharge from tile drains could be collected were extremely limited because at times when drains were discharging, drain outlets were often submerged in the receiving surface-water body and isolated samples of drain discharge could not be obtained. Drainage samples were obtained from a drain line discharging at the Fourmile Creek site. The area being drained included a substantial amount of peat and organic soils and thus, soil permeabilities were low and likely created conditions where increased filtration of bacteria limited the transport of bacteria. Fecal contamination in streamflow originating from subsurface tile drains may still be an issue. Adequate sampling of drains was not accomplished because suitable drains were not available. Streambed sediments may provide a refuge for fecal coliform like E. coli and be a source of the bacteria measured in samples of streamflow. Precipitation events that result in large overbank flows such as shown in figure 18B result in large influx of sediment from adjacent fields. If fecal bacteria are present on the surface of fields inundated by flood waters they could be transported to streambed sediments as flood waters recede and reside there for some time.
In areas of fecal contamination, concentrations of E. coli and fecal coliform are reported to be larger in bed sediments than in overlying water (Lewis and others, 1986; Burton and others, 1987; Irvine and Pettibone, 1993; Whitman and Nevers, 2003). Eight samples of water and sediment were collected from Fishtrap Creek at piezometer PZF-3 in a manner similar to a cross section. E. coli concentrations measured in the sediments ranged from 9 to 5,000 CFU/g dry sediment, while E. coli concentrations in stream water ranged from only 127 to 463 CFU/100 mL. The smaller concentrations of E. coli in the sediment samples were in the sandy coarser grained material.
A laboratory microcosm experiment evaluated the attenuation of E. coli bacteria in streambed sediments of Fishtrap Creek. Recent monitoring of fecal contamination in Fishtrap Creek and other creeks of the Nooksack River lowlands has shown persistent occurrence of fecal coliform throughout the year with typically the highest concentrations in the summer months (Northwest Indian College, written commun., 2003). The purpose of the attenuation experiment was to determine if significant numbers of fecal bacteria washed into streams during a winter storm event (fig. 18B), could remain viable in the streambed sediments until the following summer and when, if remobilized, they could contribute to the fecal coliform detected in samples of stream water.
Sediments used in the microcosm study were collected near piezometer PZF-3. The initial sediment E. coli concentration of these sediments was 144 CFU/g dry sediment, which was considered low for use in an attenuation study. Three liters of fresh dairy barnyard manure slurry containing about 20 percent solids was added to the 8 liters of sediment used in the experiment. Following the manure amendment, the initial E. coli concentration in sediment was 355,000 CFU/g dry sediment. E. coli concentrations in sediment decreased throughout the duration of the 101 day experiment until the concentration of E. coli in the final sample collected on day 101 was 186 CFU/g dry sediment; similar to the initial concentration in the unamended sediment. The rate of bacteria attenuation within the sediments was monitored by removing sediment samples from the microcosm and enumerating the E. coli concentrations on days 2, 4, 5, 12, 19, 30, 37, 40, 53, 58, 65, 98, and 101 of the experiment.
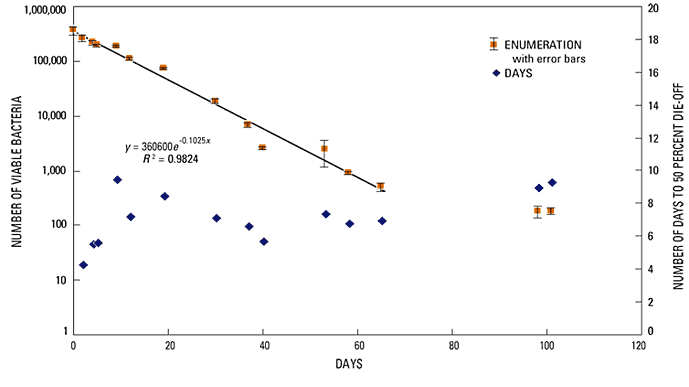
The sediment E. coli population concentrations plotted over time (fig. 19) shows a general pattern of exponential decay, particularly during the first 65 days where the regression line shows results in an exponential decay constant of 0.1025 per day with an R2 of 0.9824. The attenuation rate between 65 to 101 days was slower than during the first 65 days. The pattern of decreasing attenuation rates in the latter stage of attenuation studies has been reported in other bacteria attenuation studies (Hurst and others, 2002) and is often referred to as tailing. Tailing may result from the rapid die-off of more susceptible strains, which have larger attenuation constants, followed by a shift in the bacteria population distribution of the microbial community to strains that are hardier under the environmental conditions of the study.
This experiment showed that while some bacteria were able to survive for up to 100 days, more than 99.8 percent of the bacteria died-off during the first 65 days. Unless there was significant flow or disturbance that resulted in substantial re-suspension of streambed sediments, the large concentrations of fecal bacteria measured in the streams of the study area during the late summer period are not likely to be derived from bacteria transported from field sediments during winter storms. The 65-day die off period measured in the microcosm suggests that very limited numbers of bacteria would survive in-stream for the 6-month period from March to August after the cessation of winter storm events, and would therefore not be a major contributor to high bacteria concentrations measured in August 2004.
The rate of bacteria die-off and attenuation changed over the course of the experiment as shown in the tailing in figure 19. The initial attenuation rates observed during the first week of the experiment were somewhat higher than the overall attenuation rate. Exponential decay constants can be converted to a ‘time required for 50 percent attenuation’ values that are synonymous to radioactive half-life constants. Decay constants, calculated for the initial concentration and each measurement, were converted to ‘time to 50 percent concentration’ and are plotted with the concentration data shown in figure 19. During the first week of the experiment, the ‘time to 50 percent concentration values’ increased from about 4.5 to about 6 days. In the following 8 weeks, the ‘time to 50 percent concentration’ ranged from 6 to 8 days and increased to 9 to 10 days in the final two measurements made in the 14th week of the experiment. The change in attenuation rates indicate that the length of the attenuation experiment can have a measurable effect on the overall rate of attenuation. The use of streambed sediments amended with barnyard-manure slurry merits consideration when evaluating these results. Higher attenuation rates observed during the first week of the experiment may have occurred in the bacteria derived from a non-stream acclimated source.
Differences in attenuation rates determined for E. coli in this study and those determined in other studies are difficult to assess because of the differences in study designs. The decay rates measured in this study using manure amended sediments from Fishtrap Creek were higher than those reported by Sherer and others (1992), but lower than reported decay rates from Burton and others (1987) and Davies and others (1995). The membrane enclosed microcosm used by Davies and others (1995) resulted in faster attenuation as did the shorter duration of monitoring (14-day study) in the open flow system of Burton and others (1987). The attenuation rates determined by Sherer and others (1992) using a refrigerated 4-liter microcosm (8°C) were substantially smaller than those determined in this study. Numerous factors control the attenuation of bacteria populations, including predation, sunlight, organic matter, and size of sediment grains. This microcosm study, which replicated to the extent possible known field conditions, showed that E. coli can reside in sediments of Fishtrap Creek for several weeks to months, but are reduced in number by more than 90 percent over the course of several months.
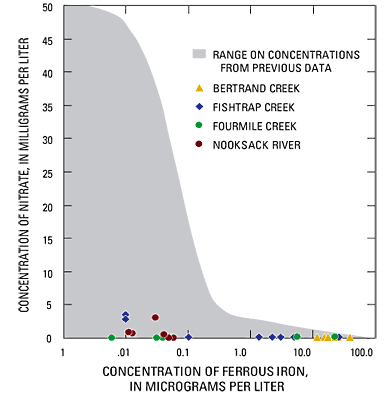
The concentrations of nitrate, ferrous iron, and dissolved oxygen were measured intermittently to characterize the quality of discharging ground water and to evaluate the potential for denitrification. Ground water discharging through streambeds in the Nooksack River lowlands typically was reducing; concentrations of dissolved oxygen and nitrate being absent or low, and often containing elevated concentrations of ferrous iron that exceeded 1 mg/L. Although these concentrations are within the range measured in ground waters of the study area, they tend to be characteristic of a small fraction of the typical range (fig. 20). These data indicate that concentrations of water-quality constituents, particularly redox sensitive species, that are typical of ground water in the area may not be typical of concentrations that are being discharged to streams through the streambed.
The absence of nitrate in discharging ground water, and the consistent detection of reduced conditions in geochemical parameters at all study sites suggest that denitrification in ground water discharging through the sediments surrounding stream channels is widespread. To assess whether denitrification is contributing to the lack of nitrate detected in ground water at the study sites, relative concentrations of nitrogen and argon gas in ground water were examined. Dissolved nitrogen and argon gases enter ground water through temperature dependent equilibration processes with the atmosphere at the time of recharge. Because these gases generally are unreactive in the ground-water system, the ratio of their concentration remains constant in ground water unless disrupted by additional gas sources such as those generated during denitrification. The amount of excess nitrogen gas in a sample of ground water can be used to estimate the quantity of nitrate reduced through denitrification to produce the excess nitrogen gas (Vogel and others, 1981).
The concentrations of dissolved nitrogen and argon gas were measured in 29 samples of ground water. Most samples were analyzed in duplicate and all concentration data are shown in tables 1-4 (at back of report). In the lower Nooksack River basin, the average temperature of recharging ground water in contact with the atmosphere is about 10°C, but may range from 9 to 11°C). The concentration of dissolved argon in ground water in equilibrium with the atmosphere at a ground-water temperature of 10°C is 0.67 mg/L. Many of the samples showed anomalously low concentrations of argon, indicating that some gases were stripped from the samples, yielding measurements that were ambiguous with respect to estimates of denitrification. Ground-water samples that were found to contain less than the typical argon content, or with a relative difference between duplicate samples of more than 1 percent, were considered to be compromised (potentially having been stripped of some gases) and eliminated from consideration as indicators of denitrification.
Gas stripping likely occurred during the sampling process as the water was exposed to reduced hydrostatic pressures generated from the peristaltic pump used with small diameter tubing. Most samples from study sites at Fourmile and Fishtrap Creeks showed extensive gas stripping and were deemed unsuitable. About one-half of the samples collected from the Bertrand Creek and Fishtrap Creek sites were usable. The increased length of tubing needed to connect the piezometer point to the sampling pump at Fourmile and Fishtrap Creek sites likely increased the gas stripping occurrence at these sample sites.
"Excess air" commonly is found in ground-water samples and results in larger dissolved gas concentrations than would be expected based on air-water equilibration alone. Excess air occurs when additional quantities of atmospheric gases are incorporated into the ground water from air bubbles that become trapped in ground water during recharge (Heaton and Vogel, 1981). Figure 21 shows the solubility line for argon and nitrogen in ground water equilibrated with the atmosphere at temperatures from 5 to 30°C along with a line showing concentrations present in ground water at 10°C with 0 to 15 mg/L of excess air. The shaded (grey) portion of the excess air line illustrates the range of argon and nitrogen concentrations that would be expected if 0 to 5 cm3/L of excess air are trapped in ground water recharging at 10°C. Tesoriero and others (2000) reported concentrations of nitrogen and argon in aerobic ground water collected in the upper reaches of the Fishtrap Creek basin (near PZF-1 and PZF-3) that fell within the shaded grey area plotted in figure 21. Their data provides additional evidence that the concentrations of gases in the recharge to the Sumas aquifer are consistent with those detected in ground water for this study, and support an interpretation that conditions of excess air were present in ground water at some of the study sites. Two data points measured in ground water collected from Bertrand Creek plotted in figure 21 show evidence of excess gas incorporation. The points are shown adjacent and slightly above the excess gas solubility line.
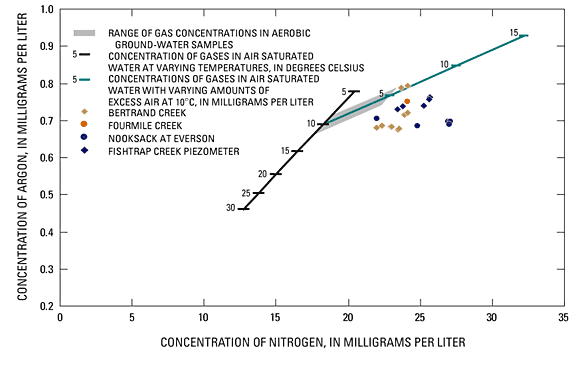
Dissolved gas concentrations in ground water considered to be uncompromised are plotted in figure 21. Excess nitrogen gas (in the absence of excess argon gas), indicates denitrification, and was measured in ground-water samples from all study sites. Measurement points shown in figure 21 that plot horizontally to the right of the excess air recharging at the 10°C line indicate that excess nitrogen gas was detected in these samples. The concentrations of excess nitrogen gas varied by as much as 8 mg/L with typical concentrations of excess nitrogen gas of about 2 to 4 mg/L. Two units of nitrate are reduced for each unit of nitrogen gas produced. Thus, the dissolved gas data suggest that from 4 to 8 mg/ L and in some cases as much as 16 mg/L of nitrogen as nitrate in ground water have been denitrified.
Evidence of denitrification was observed at all sample-collection sites. Low dissolved-oxygen concentrations, and the presence of dissolved ferrous iron, suggest that the reducing conditions necessary for denitrification to proceed are present. The excess nitrogen gas detected in ground water at the Bertrand Creek and Nooksack River sites indicate that denitrification has generated nitrogen gas. Low concentrations of nitrate measured in surface water, and high concentrations reported in upgradient areas of the Sumas aquifer suggest that nitrate concentrations are reduced at some point along the ground-water transport pathway, before discharging to surface water. Puckett (2004) suggests that denitrification may not occur throughout much of the aquifer, but more likely takes place in the sediments and riparian areas surrounding streambeds, where reducing conditions are more common.
Some of the nitrate contamination present in ground water may not ultimately be transported to surface waters. In agricultural areas, nitrate concentrations in ground water commonly are larger than nitrate concentrations in surface water (Mueller and others, 1995; Bohlke and others, 2001). In an area of the South Platte River system where McMann and Bohlke (2000) found that the load of nitrate measured in surface water was about 70 percent less than expected based on input of ground water from the adjacent area; with about one- half of the deficit being attributed to denitrification. In the Nooksack River lowlands, the median nitrate concentrations in surface water for Fishtrap Creek (1995 to 1998) was reported to be 2.8 mg/L (Embrey and Frans, 2003). Fistrap Creek drains much of the Sumas aquifer in which the median nitrate concentration of ground water was substantially larger than 3.8 mg/L (1991–1993) as reported by Cox and Kahle (1999). Although the sampling periods for surface and ground water from the Nooksack River lowlands were not coincident, nitrate concentrations in ground water of the Sumas aquifer have been reported to be increasing (Kaluarachchi and Almasri, 2002), thus there may be a similar trend of lower than expected surface water nitrate load as described by McMann and Bohlke (2000) for the South Platte River.
For more information about USGS activities in Washington, visit the USGS Washington Water Science Center home page .

![]() U.S. Department of the Interior |
U.S. Geological Survey
U.S. Department of the Interior |
U.S. Geological Survey
URL: https://
Page Contact Information:
Page Last Modified:
