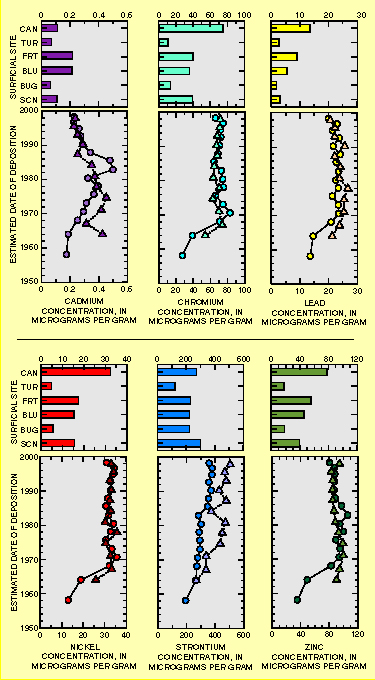
Figure 2. Concentrations of trace elements in surficial sediments and cores. MER core samples are shown by circles, and SY core samples by triangles.
Back to Contents | Figure 3